Code
library(tidyverse)
library(widyr)Purpose of the tutorial: To demonstrate a quick and straightforward implementation of time series clustering using the widyr package in R
What is time series clustering?: Grouping time series data into clusters where data points in the same cluster group are more similar to each other than to those in other clusters. For example, if we have monthly sales data, time series clustering can help identify stores with similar sales patterns over time.
library(tidyverse)
library(widyr)About the data:
Fake dataset that can be downloaded from my GitHub.
Contains 832 rows & 3 columns
Columns:
year (<date>): Date information for each observation.
storecode (<chr>): Unique identifier for each store.
sales (<dbl>): Sales figures for each store.
Importing data: Using read_csv()
store_list <- read_csv("https://raw.githubusercontent.com/zahiernasrudin/datasets/main/sample_store.csv")| year | storecode | sales |
|---|---|---|
widyrUsing widely_kmeans for time series clustering:
# Perform k-means clustering using widely_kmeans
cluster_group <-  store_list %>%
  widely_kmeans(item = storecode,
                feature = year,
                value = sales,
                k = 3)

# Join the clustering results back to the original data
store_list_with_cluster <- left_join(store_list, cluster_group)
Define item:
storecodeDefine feature:
year columnDefine value:
salesDefine k:
Joining Results: The clustering results are joined back to the original dataset.
ggplot2.library(ggthemes)
store_list_with_cluster |>
ggplot(aes(x = year, y = sales, group = storecode, colour = cluster)) +
geom_line(show.legend = F) +
scale_y_continuous(labels = scales::comma) +
facet_wrap(vars(cluster)) +
scale_color_solarized()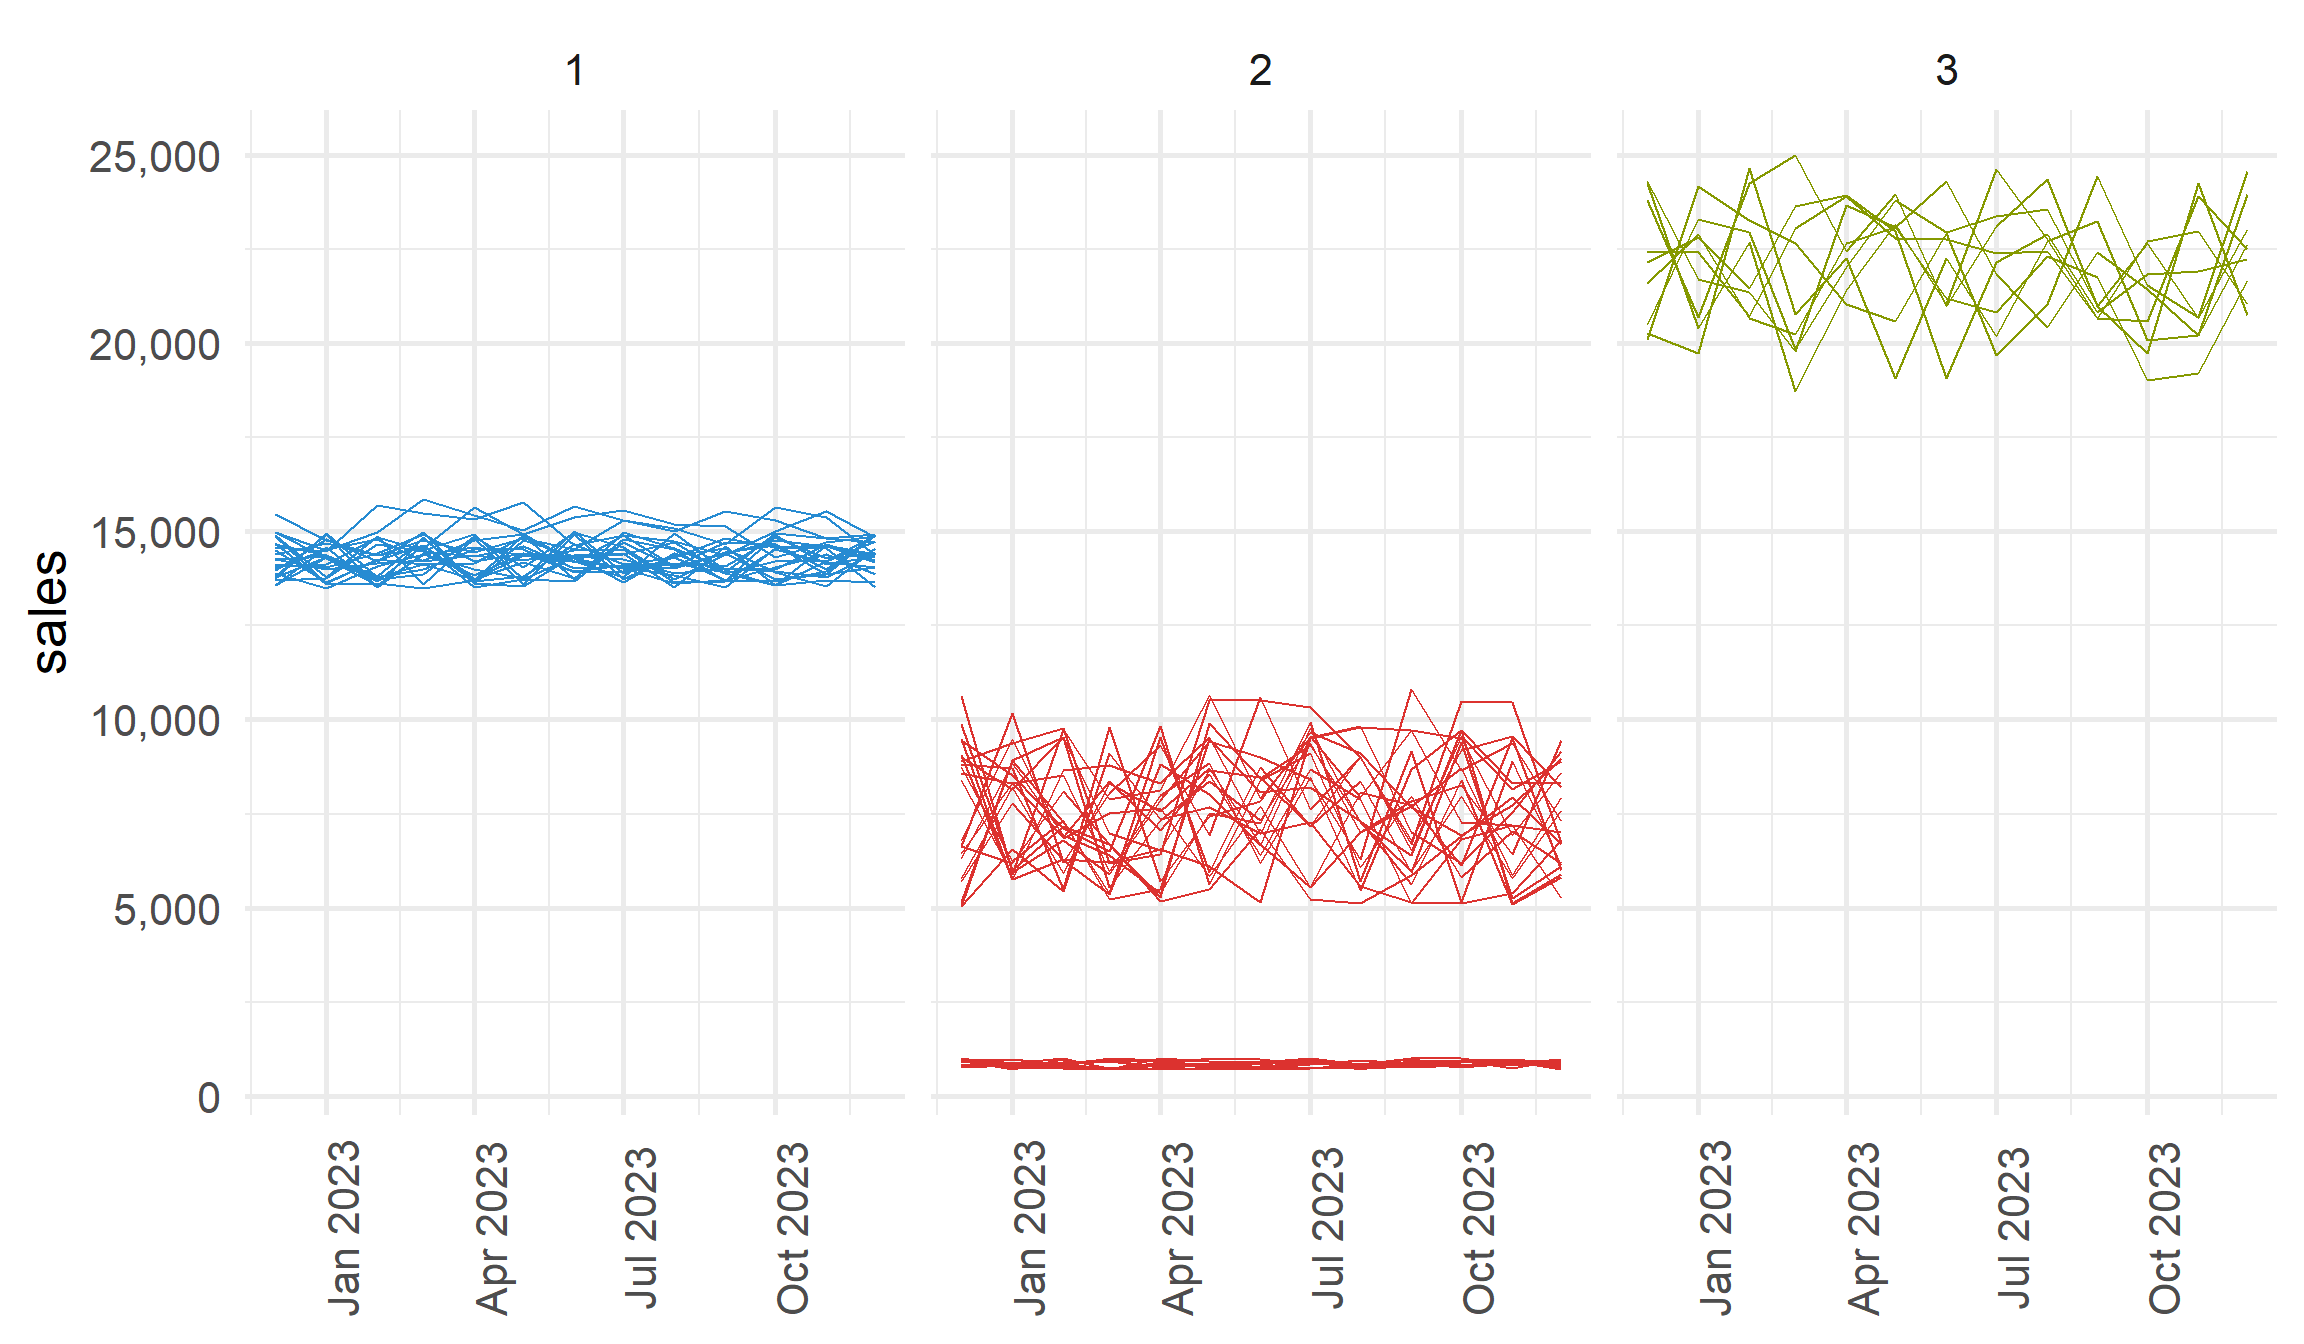
widyr package in R. Of course, there is much more you can explore and refine in your clustering analysis. For comprehensive documentation and further exploration of the widyr package, visit the widyr page itself: widyr Documentation.